
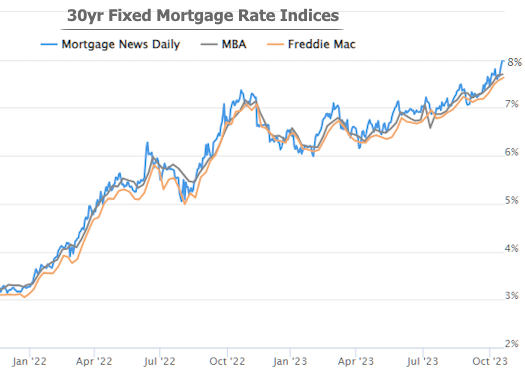
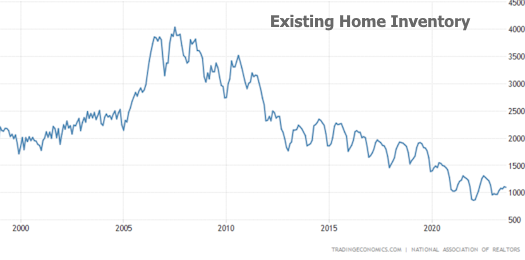
Mortgage rates finally broke the 8% ceiling this week after months of gradual upward movement in the 7% range. At the same time, Existing Home Sales fell to the lowest levels in more than a decade. Pretty gloomy... but there are silver linings and perhaps even some overly optimistic Kool Aid to drink. As always, we'll try to focus on the warm bowl of porridge in the middle.
It's very true. The following charts of home sales and interest rates are not great.

But unlike the last time home sales were this low, we're in the midst of a supply shortage as opposed to a glut.
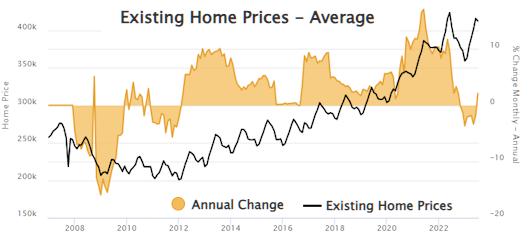
That has allowed the housing market to be much more resilient in terms of home prices. In year-over-year terms, prices are already back in positive territory.
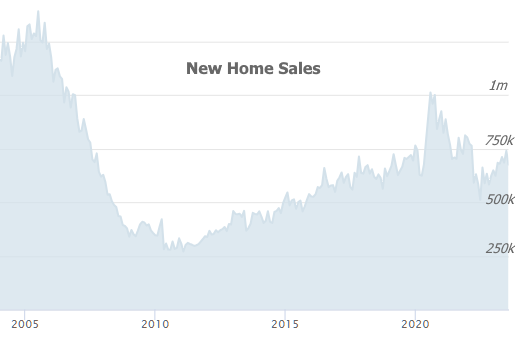
We can also consider that the charts above pertain to EXISTING home sales, where the inventory depends on homeowners wanting or needing to sell. With many of those homeowners still paying the 2-3% mortgage rates obtained 2020-21, the reluctance to give that up in favor of a 7-8% rate is no surprise.
That's why the charts look much better when they focus on new home sales, which are nowhere near their 2010 levels. In fact, they've been trending higher and are currently in line with pre-pandemic levels.
For those who want to take silver linings into potential "Kool Aid" territory, we could start to look at things like the balance of recent Fed comments which suggest the Fed is done hiking rates unless inflation flares up in an unexpected way. Just this week, that sentiment helped turn the tide after this week's strong Retail Sales sent Fed rate expectations quickly higher on Tuesday. By the end of the week, the market saw next year's Fed Funds Rate about a quarter of a point lower.
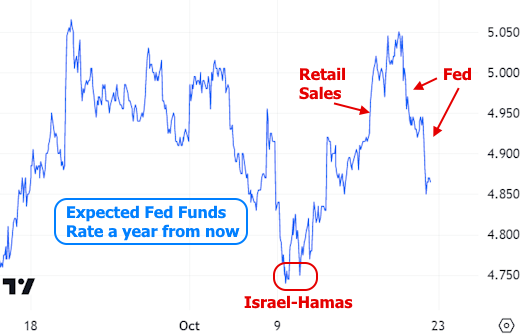
That has some market participants declaring that the big shift in rates has arrived.

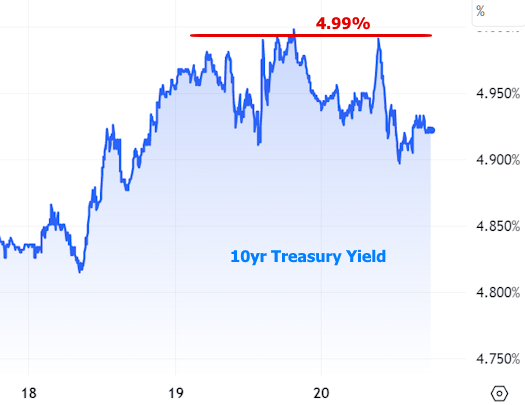
Ceiling sentiment gained some momentum after several supportive bounces in 10yr Treasury yields on Thursday and Friday just under 5%. Many investors have been saying 5% is an important psychological level and an attractive entry point for bond buyers (buying pushes yields lower). If investors are putting their money where their mouths are, it would line up with these sorts of bounces.
The proverbial "warm bowl of porridge" is somewhere between the gloom and the hope. It usually is. It's also impossible to perfectly define in terms of scope and timing. There are scenarios that could indeed result in rates moving gradually lower from here. Or the big shift might not happen for months. Some say it is overdue already. Others say "wait for 2025!"
There are ways to make cases for both outcomes, but the actual outcome will be driven by economic data. The good news there is that the Fed expects a certain measure of resilience in the data. They won't freak out if unemployment remains under 4% or GDP rises above 4%. As long as inflation continues to moderate and the economy doesn't accelerate at an unsustainable level, they're pretty sure they're done hiking rates.
That doesn't mean the Fed is done with "restrictive" policies, just that the restriction will now come in the form of a ticking clock. In other words, the question is less about additional rate hikes and more about how long we spend at current rates. Markets tend to push consumer rates lower before the Fed officially cuts, but there again, the market would only do that if it saw data that was likely to lead the Fed to similar conclusions.
After an active slate of Fed speakers over the past 2 weeks, we now enter the scheduled blackout period which precedes every Fed rate announcement. The next announcement is on November 1st. The Fed is not expected to hike, but markets will be attuned to any verbiage changes in the statement.
In the meantime, the upcoming week of data is not as critical as the following week will be. We're especially focused on the jobs report due out on Friday, November 3rd. If it reiterates the uncanny strength of the previous report, Team Gloom will score some points. But if it paints a much more moderate picture, the Kool Aid will be looking safer and safer to drink.