
NOTE: this is an early version of the weekly newsletter that normally comes out on Friday. There will be no newsletter on Friday due to the Thanksgiving holiday.
Mortgage rates have fallen significantly in November. For the housing market, it couldn't come at a more critical time, but the road ahead remains uncertain--mostly due to timing.
Here's what we're up against in terms of home sales (includes the most recent monthly result released this week):
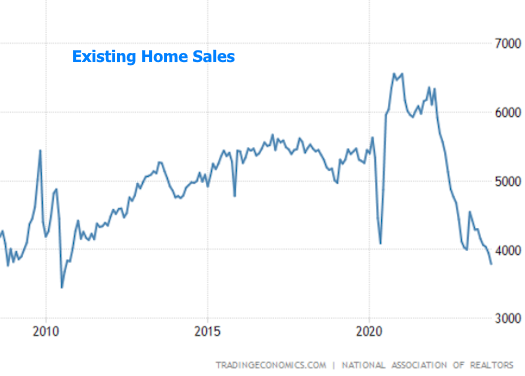
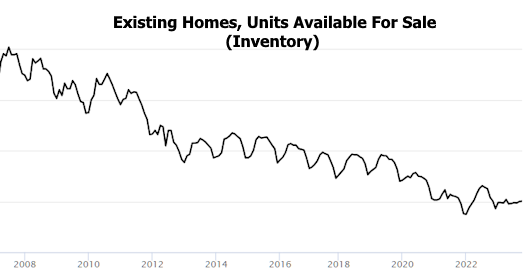
Keep in mind that the market for EXISTING homes has been under more pressure compared to NEW homes. Some would say this is due to builders being able to offer financing incentives big enough to help buyers overcome affordability issues created by the highest rates in decades. Others would say that it's hard to sell many existing homes if people aren't interested in listing them for sale. Neither are wrong.
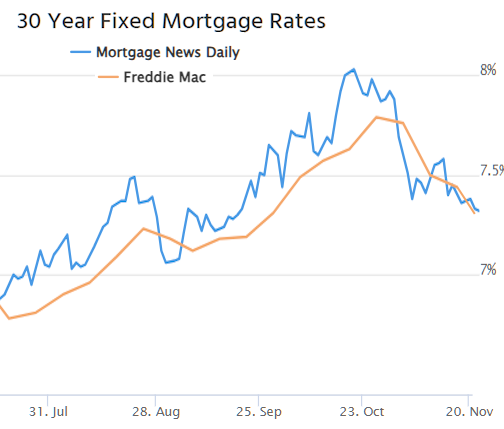
About those "highest rates in decades"... that's not exactly the case thanks to the past 4 weeks of improvement.
Mortgage applications are already acknowledging the shift.

The bigger drop earlier in the month was due to a mix of economic data and events that happened to arrive at the same time that the Fed confirmed its rate outlook wasn't quite as bad as it conveyed at the September meeting (here's a recap). Last week's inflation data helped confirm that shift.
Other advance indicators like energy prices are helping investors feel calmer about believing that inflation has a chance to keep moving back toward target levels.

All that having been said, it's important to remember how convincing some of the previous "false starts" have been.
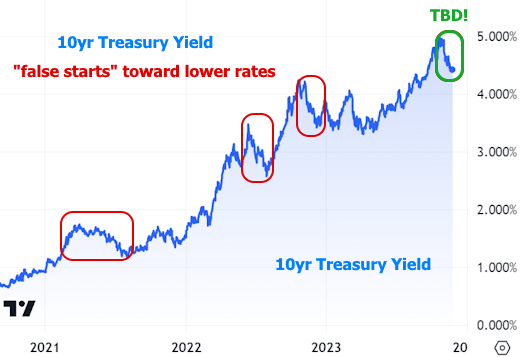
If we zoom in on the chart above (10yr yields are a good proxy for momentum in longer term rates like mortgages), we can see the inflection point around 4.38%. This acted as a ceiling before the September breakout and is now acting like a floor as the recent rate rally cools down.
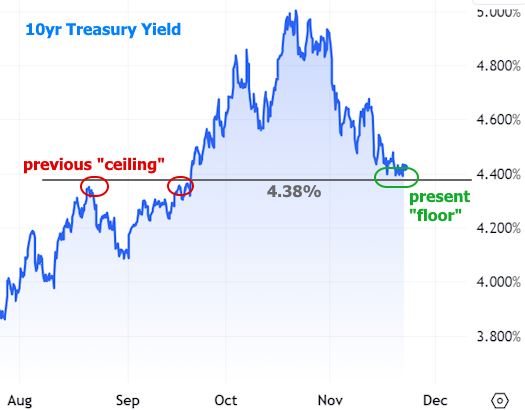
Nothing about this line predicts the future. It is merely a milestone to be crossed, and it certainly will be crossed. Timing is the only uncertainty.
Economic data and inflation have helped get us this far and the same factors will be critical in determining the next step. That said, not just any economic data will do. There are only a handful of top tier reports that markets rely on for validation of highly consequential decisions.
The last time we saw any such data was last Tuesday and Wednesday. It's no surprise that subsequent days have been less volatile by comparison. The next glimpse of similarly important data will be the first full week of December culminating in the next jobs report on Friday the 8th.
This isn't to say that the upcoming week has nothing to offer. Rather, it could only be viewed as an opening act for the big show coming up in the following week. As always, interest rates thrive on uncertainty and economic weakness. The weaker the labor market, the more certain it becomes that 10yr yields will be moving (and staying) below 4.38%--a milestone that suggests mortgage rates in the low 7% range.