
By this time next week, we will have heard from the Fed as they announce the next rate hike on September 21st. It will be big too. Just how big is a matter of debate. 0.75% is a safe starting point, but 1.00% will be on the table as well. The former would match July's hike--the biggest since 1994. A 1.00% hike hasn't been seen since 1982.
Desperate times call for desperate measures, and the Fed is desperate to push back against the highest inflation in decades.
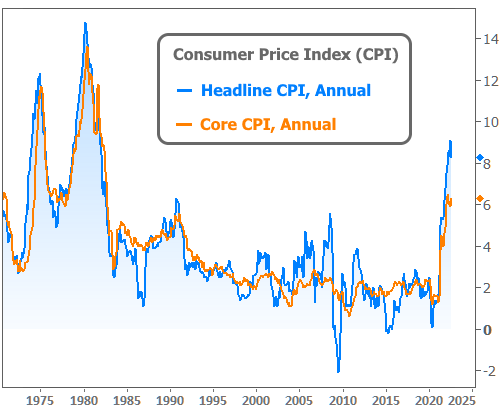
The Consumer Price Index (CPI) is the oldest and most widely-followed measure of overall inflation in the US. The Fed targets an inflation rate of 2.0% at the core level (orange line above). That mission was going about as well as it had ever gone for most of the past 2 decades until covid. For a variety of reasons, the Fed dragged its feet a bit in responding to post-covid inflation threat and has since been scrambling to catch up.
That "scramble" is evident across financial markets. The typical reaction for stocks and bonds alike is to SELL SELL SELL when the Fed sends unfriendly messages. When traders sell bonds, rates rise. Stocks obviously move lower when sellers are in control. The net effect looks like this:
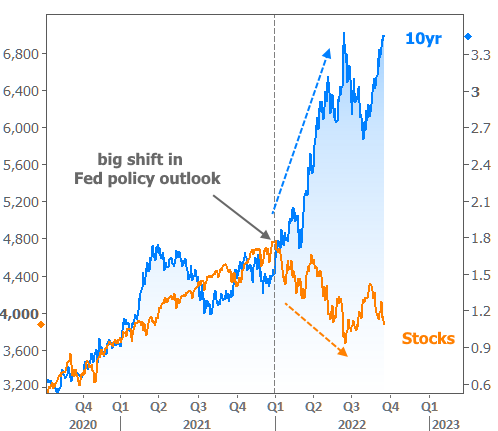
What are the "unfriendly messages" and the "shift in the Fed policy outlook" specifically? Back in January, the big wake-up call was the Fed's clear communication that its rate hike timeline would play out much more quickly than it did during the 2013-2018 tightening cycle. As Fed speakers made that increasingly clear via speeches and official policy communications, stocks and bonds continued to freak out.
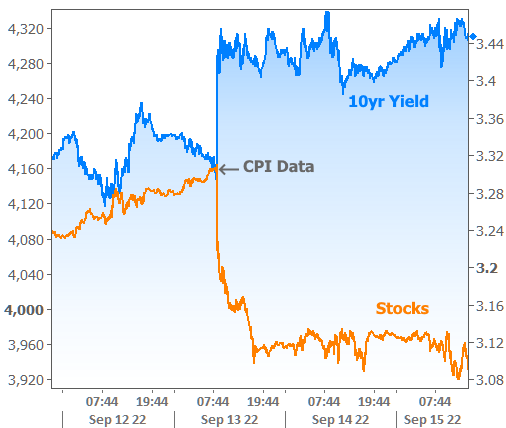
Once the market feels like it understands the Fed's mindset, it doesn't wait around for such speeches. If traders know the data that the Fed cares about, traders will react to the data itself. In the current case, things are fairly simple because inflation has no other competition for the Fed's focus. When this week's CPI data came out hotter than expected, traders knew what to do.
Thankfully for consumers, the data actually didn't show much of an increase in overall monthly obligations --something best measured by the headline CPI as seen here:

The headline number includes every price collected in the CPI report. It didn't rise at all in July and only rose 0.1% in August. That's the good news. The bad news is threefold. First, it was only as low as it was due to declines in fuel prices. Second, the Fed famously focuses on "core" CPI, which excludes food and energy.
We find the third piece of bad news in the data itself where Core CPI defied forecasts by a wide margin, surging to 0.6% versus expectations to hold steady at 0.3%.

If you noticed that the percentages in the last 2 charts are much smaller than the first chart, that's because these are month-over-month numbers. The first chart is expressed in annual terms, and it's in those annual terms that the Fed would like to see core inflation around 2.0%. Obviously, if every month was increasing at 0.6%, that would leave us at 7.2% in annual terms! Hence the sense of urgency in financial markets and the ramped up expectations for next week's rate hike.
Now's a good time to answer the headline question of "what really matters?" While it's true that the market could experience a lot of volatility next week if the Fed hikes by 1.0% instead of 0.75%, traders have been making much bigger changes to the Fed's rate hike outlook for the subsequent meetings.
How can traders change the Fed's rate hike outlook? They don't, really. They simply make bets as to where the Fed Funds Rate will be after any given month's Fed meeting. The following chart shows how those expectations have moved over time for next week's meeting as well as those in December and next June (there's a lot going on in this chart and we'll break it down in more detail below).
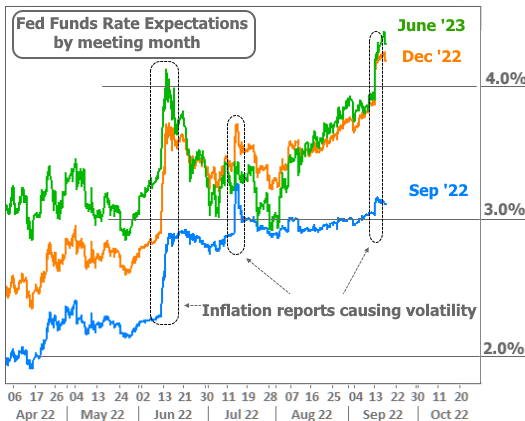
Let's break it down in steps:
1. Note that the expectations for next week's meeting didn't really move much in the bigger picture. A 0.75% hike was 100% expected before the CPI data. Now there's a 20-30% chance of a 1.00% hike.
2. Note that most of the big spikes in 2022 have followed inflation reports. Early August was an exception, mainly for the longest-term outlook, and there were good reasons for that (surprisingly strong economic data, which said less about short term inflation and more about the staying power of existing inflation)
3. Note that traders already saw the Fed hiking to 4.0% by the end of the year before the CPI data and now they see at least 4.25% with no relief by June 2023. Contrast that to late July when the green line was below the orange line (i.e. traders saw the Fed Funds rate falling between December 2022 and June 2023).
Simply put, the market got its hopes up for a friendly rate scenario by late July and has been forced to do an abrupt 180° since then, both due to economic data and inflation reports. This week's was just the latest example. It happened to have an outsized impact because it's a highly uncertain time for inflation. Economists are looking for signs (and in some places, seeing them) that inflation has turned a corner.
They were also worried about the possibility that those positive signs were merely byproducts of plummeting oil prices. This week's core CPI data says that worry is valid. It doesn't help that Fed speakers are in their blackout period (12 days without Fed speeches leading up to an official policy statement) and that almost all of them have said they would let data determine the size of the next hike.
But to reiterate, it's still not the size of next week's hike that matters most. What matters most (or at least more) in no particular order will be the Fed's own rate hike outlook. This is conveyed in the form of a dot plot in the Fed's "summary of economic projections" or SEP. The SEP is released at 2pm along with the rate hike announcement. It frequently moves markets far more than anything in the announcement itself, and thus frequently leads to the faulty conclusion that the market is responding to the Fed's rate hike.
In the case of the current meeting, the rate hike actually has more market moving power than average due to the uncertainty on the size of the hike.
Mortgage Rates and Housing Markets
Let's connect the dots, briefly, to how this has impacted the mortgage market. Here too, it's not the Fed Funds Rate itself or the short term outlook that matters as much as the longer term outlook. The Fed has also fully exited its bond buying programs as of September 15th. Although that dagger in the heart had been planned for months, daggers still hurt. Fed bond buying had been a major source of downward pressure on rates until they began to taper their buying amounts in late 2021.
A few sidenotes for anyone involved in the mortgage process these days:
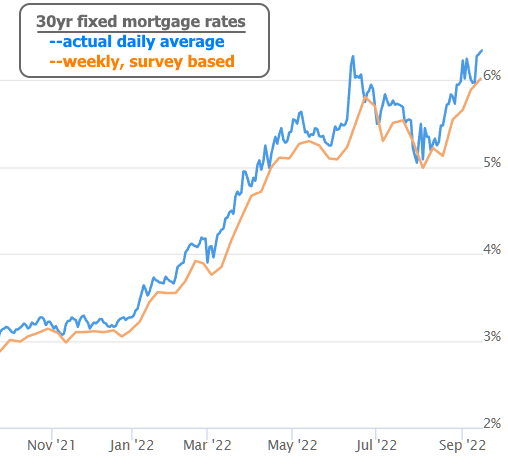
First off, note that rates first moved over 6% in June and were back above that line for most of September. Widespread media coverage of Freddie Mac's weekly rate survey (which just now moved above 6%) led to the mistaken impression that this was a new development. Even then, high rates might not be as frustrating for some borrowers right now as is the lack of "premium."
Investors who buy mortgages historically pay a premium (think of that like paying $310k on a $300k loan) and then count on earning that premium back with interest over time. When rates have surged much higher and there's even a shred of hope that they could stabilize enough to spark refinance activity in the next few years, investors REALLY DON'T LIKE THE IDEA of paying that premium. This is one of the altruistic reasons for the now-infamous "prepayment penalty" that existed before the regulations put in place after the financial crisis. In this environment, what would have been the prepayment penalty is now simply paid by borrowers upfront in the form of higher closing costs.
All that to say that it's very hard or even impossible to cover all the necessary upfront costs on certain loan scenarios simply by raising the rate. In the past, raising the rate got you more premium from the lender/investor. These days, that premium really isn't there, or it's simply too small to make sense. This will change over time, but it will require rates to be lower and much less volatile.
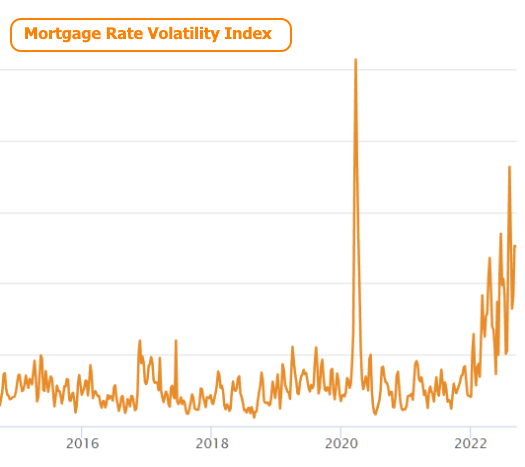
Speaking of volatility, congratulations! You're living through an era that hasn't been seen in more than a generation when it comes to the persistence of exceptionally high volatility (it was briefly a bit higher for small pockets of time in the past, such as March 2020, but it hasn't been this elevated for this long since in 40+ years).
Last but not least, as word on conforming loan limits. This refers to the maximum amount of a loan that can be delivered to Fannie Mae or Freddie Mac, the two agencies that guarantee a majority of mortgages in the US. Conforming loans are typically more desirable than others due to lower rates and streamlined, standardized underwriting processes. The amount is determined by Fannie and Freddie's regulator the FHFA (not to be confused with FHA).
Conforming loan limits (CLL) go up any time home prices rise from Q3 to Q3. FHFA publishes the relevant Q3 data at the end of November and loan limits go into effect for loans "delivered" to Fannie and Freddie starting January 1st ("delivery" can happen weeks or even months after a loan is originated). Because of that, lenders have increasingly gotten a jump on expected changes in the CLL. There's just one problem.
We don't have ANY of the Q3, 2022 home price data from the FHFA yet. Lenders are guessing at the changes in prices between now and then during a very volatile time. Several lenders have pulled this trigger already this year--far earlier than last year. The magic number seems to be 715k. If those lenders are willing to honor lock commitments even if the official loan limit comes in lower, that's their business and shouldn't have an implication for borrowers or originators. The only point of this update is to clarify that the CLL HAS NOT YET BEEN CHANGED. There are a few lenders sticking their necks out to guess at what the change will be, but it won't be officially announced until Tuesday November 29th.
