
The average 30yr fixed mortgage rate officially moved over 7% this week according to major weekly surveys, but mortgage rates actually moved lower!
Why the discrepancy? It's fairly simple. Weekly rate surveys lag reality. For instance, most of the responses for Freddie Mac's survey (the most widely cited among news organizations) are in by Tuesday, and the results aren't published until Thursday. Wednesday through Friday are essentially uncounted.
That means if rates rise abruptly at the end of the previous week and fall meaningfully at the end of the following week, the Freddie survey will say "HIGHER" while the reality is "LOWER." That's exactly what happened over the past 2 weeks.
None of this is to suggest that rates are "low" in outright terms, only that the day to day trend was as friendly as it's been in a long time this week. Also of note, news stories focused on the break above 7% as if it were a new thing whereas it actually happened in late September and again in early October.
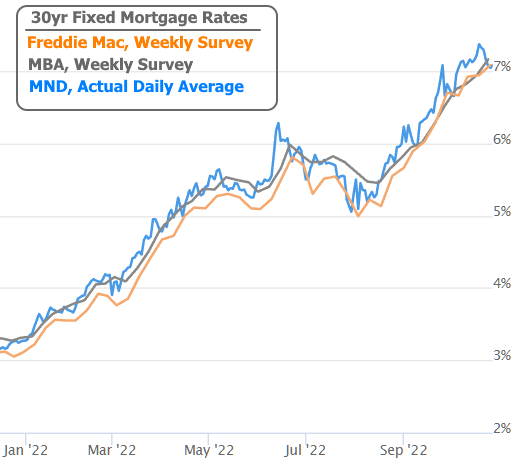
Rates were able to recover for a few reasons. First off, they were just really really high! Last Thursday easily marked new 20 year highs for mortgage rates and the rest of the rate world was having a rough time as well. The more even-keeled 10yr Treasury yield, the world's leading benchmark for longer term rates, hit the highest levels in 15 years.
This abrupt rate spike was the main subject of our discussion last week and at the time, we noted that bond trading was breaking down into a somewhat panicked state. The panic ended on Friday after a Wall St. Journal article suggested that while the Fed would hike by the expected 0.75% at the next meeting, they would also be debating the size of future rate hikes due to growing doubts about what has thus far been a "full throttle" approach. Only about an hour later, one the last Fed speakers of the week, Mary Daly made similar comments in a scheduled appearance.
With that, the market immediately began trading "the Fed pivot." This simply refers to a shift away from what has been the fastest pace of rate hikes since the early 80s. But whereas "pivot" might imply a move in the opposite direction, it's important to understand the limitations of this particular pivot.
Most importantly, the Fed has been very clear in saying they intend to hold rates at a terminal level (fancy banker talk for "ceiling") for as long as possible in order to be absolutely sure that inflation is defeated. Naturally, opinions vary on whether that's even necessary, but the Fed has their reasons for not wanting to risk doing too little.
In other words, the "pivot" is really just a deceleration of the rate hike pace. A plateau at what will be the highest Fed Funds Rate since 2007.
So if the Fed isn't expected to cut rates (again, they're going to hike next week, and likely hike again in December), why would rates move lower in response to this notion of a pivot? It all has to do with expectations. The interest rate world doesn't simply wait around for a Fed rate hike if it knows what's coming. Everything that can be known or reasonably expected about the future is traded into current rate levels. That means any changes to the outlook are free to have an impact on today's rates.
And that's precisely why rates moved lower after Friday's headlines. Traders gradually lowered their expectations for the Fed's terminal rate.
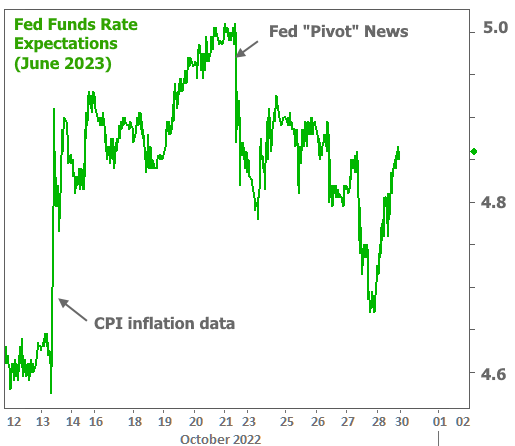
The chart above may look like a somewhat bumpy ride back toward slightly lower levels, but here's how the same chart looks over a longer time frame:
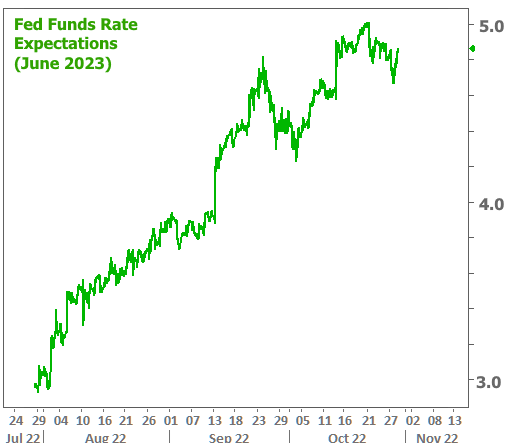
Incidentally, that vertical line in September was also an inflation report. That's been the story of mid-2022. Rate expectations spike after inflation surprises and then level off to wait to see if there will be another surprise. We're very much in a waiting phase right now. Additional clarity comes next week not only from the Fed announcement, but also from economic data.
In addition to inflation, the Fed cares about economic data because a weakening economy would provide evidence that its anti-inflation policies are working. Some reports are more important than others in that regard, and next week's jobs report on Friday is arguably the most important apart from CPI (the Consumer Price Index which serves as the first major look at inflation for any given month).
In addition to the jobs data, there are several other relatively important reports next week. If they paint a generally gloomy picture, that's bad for the economy, but good for rates. If they're surprisingly upbeat, rates could see some more upward pressure. Either way, it will be the following week's CPI report for the month of October that casts the final vote on whether it's really time for a big pivot in 2022's rising rate momentum.
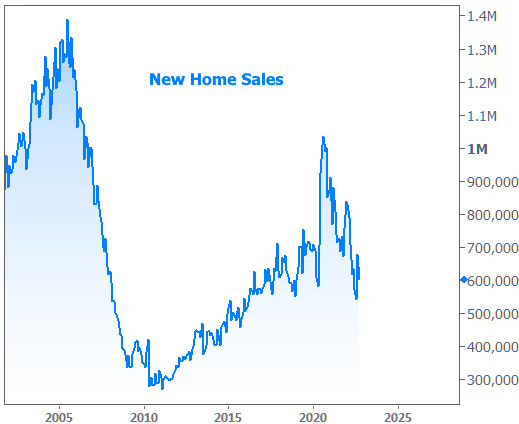
charts from this week's housing-related econ data:
Pending home sales dropped sharply. This is the most timely of the big-ticket home sales reports as it measures contract signings as opposed to finalized sales.

New home sales are just that: new construction. They'd spiked abruptly last month as builders held fire sales in the face of rising rates, but snapped back to reality in the most recent numbers. Both the spike and the snap back are lost in the shuffle by the time we zoom out to include the big picture context.
Home prices are still strongly positive year-over-year but falling at a quick pace in month-over-month terms. This is expected, and arguably necessary if you agree that price gains were overdone by the end of 2021. The ability for prices to make a soft landing without significant year over year declines will depend on geographical specifics as well as the way the rate narrative unfolds in 2023 (and inflation, and inventory, and incomes, and... you get the point. It depends.).


